The future of business intelligence is here: your whole business in a single personalized Dashboard. Smart Power BI Reports and Dashboards are interactive, refreshed in real time and provide an instant overview.
ADVANCED REPORTING SOLUTION
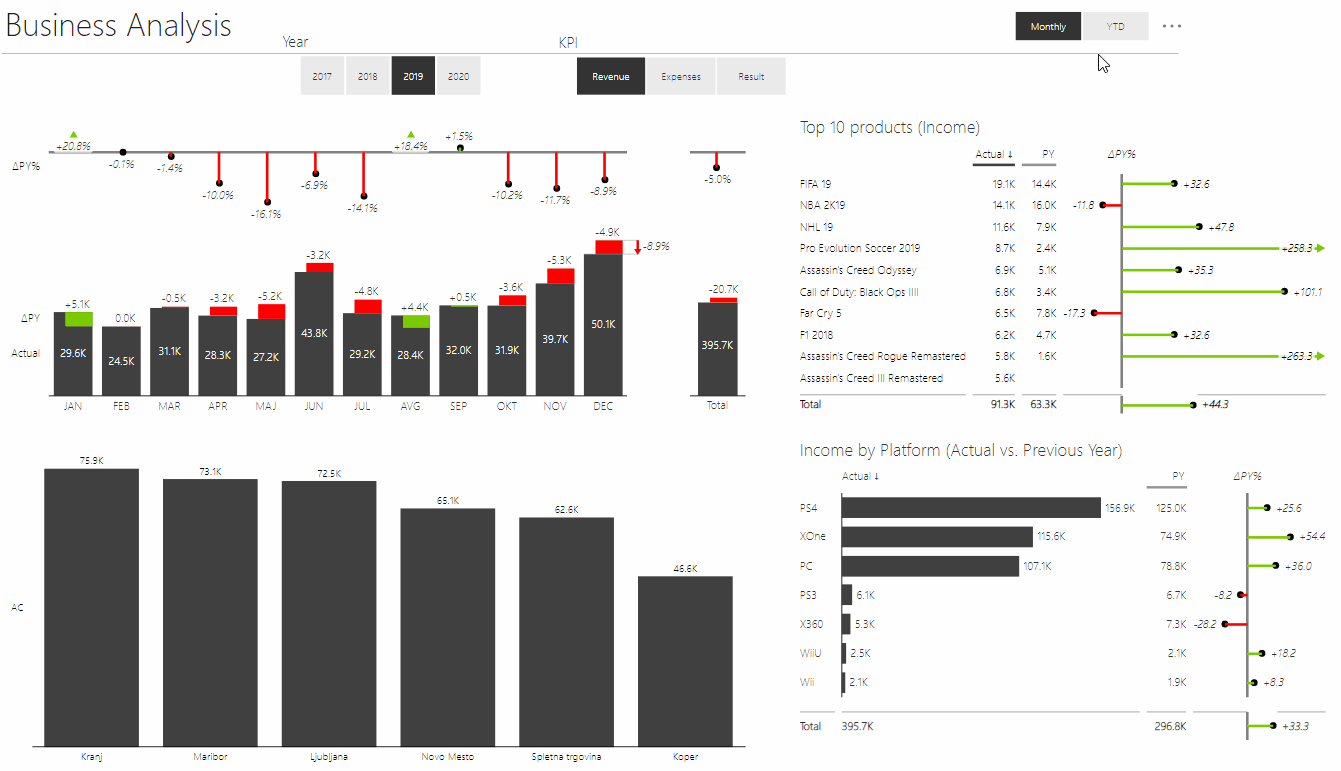
Interactive reports
Power BI reports are interactive. Visualizations can be drilled down to reveal all the details, or merged into bigger aggregates. Data can be observed for different time periods, products and locations. We can ask questions and draw plots using simple keywords in Q&A tool.
Let’s look an example in the image below:
Data anytime, anywhere, on any device
Reports are refreshed in real time and are always up to date, providing an instant overview. They can be viewed on any device and browser. They can be shared with entire organization or selected team members. Users can create their own Dashboards from selected report elements.
Connect to any data source or service
Power BI can connect to more than 60 sources of data, from databases to files and online services. We no longer need to track our data through various sources and services, Power BI enables us to import, process and track all data in one place.
INDIVIDUAL COACHING: USING ADVANCED REPORTS
We coach end users of Power BI reports. Coaching takes place individually or in a group, on location, at Unija Smart headquarters or online. End users coaching is included in the price of a Power BI project.

End users know how to:
- use reports on all devices
- use different slicers. e.g. Year slicer (2017, 2018, 2019), KPI slicer (Revenue, Income, Expenses) and Mode slicer (Monthly, YTD)
- filter data
- drill down for details
- ask questions and display data on charts using Q&A
- turn Q&A answers into visualizations
- create their own Dashboards from report elements
- save data from visualizations
- set alarm for different KPI values in Dashboards
- share reports and Dashboards with team members
EDUCATING
We provide consulting and support for Power BI, Excel, Power Query and Office 365. We hold courses appropriate for beginner, intermediate and specialist level:
We also organize a number of free educational events. Power BI Summer School is a series of free lectures, held in summer months.
KNOWLEDGE BASE
Weekly we share tips and tricks for Power BI Users in our Knowledge Base. We already looked at benefits and savings Power BI reports bring in our Power BI- 5 Benefits article and reviewed the rules of written communication in business world in International Business Communication Standards.
More info on website: bi.unija.com/en